
A 3,000-year wave height event during Cyclone Gabrielle
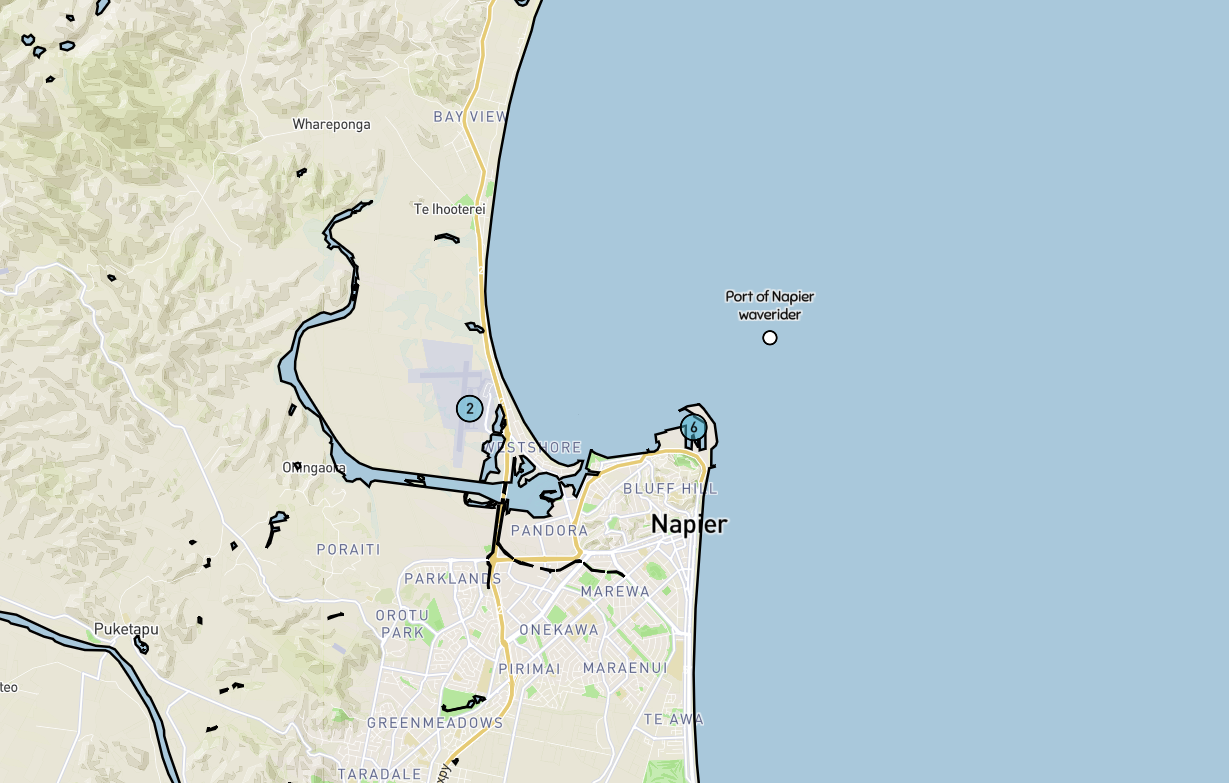
Figure 1: Map showing the Port of Napier’s Wave Rider location where the 6 m Hs was recorded.
On 14 February 2023, during Tropical Cyclone Gabrielle - the worst storm to hit Aotearoa New Zealand this century - Port of Napier’s Wave Rider Buoy measured significant wave heights (Hs) of up to 6 meters, before waves broke it free from its mooring. Although the buoy was situated just beyond the breaking zone, it is likely that a single large individual breaking wave or intense white capping could have led to the breakage of the buoy mooring.
When our science team spotted this remarkably high measurement, Oceanographer Dr Séverin Thiébaut decided this was the perfect opportunity to validate our in-house wave model and perform an extreme value analysis to understand how frequently events of this magnitude happen.
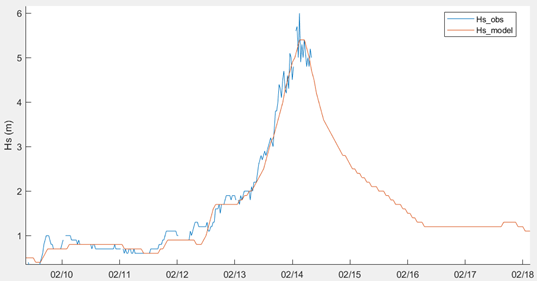
Figure 2: Time series of the measured (blue) and modelled (red) significant wave height at the Wave Rider shows that the forecast model captured the storm-induced waves well.
The analysis showed that the forecast correlated well with the Wave Rider measurements, capturing both wave timing and height (see Figure 2). The highest measured significant wave height was 6.0 m, compared to the forecast height of 5.4 m.
“The wave height forecast was good for such a narrow, moving system,” says Séverin. “It is encouraging that the model performed well under these extreme cyclonic conditions.”
To understand the frequency of events, we need information on the historical wave climate for the site of interest. At MetOcean Solutions, we maintain numerous high-resolution model datasets that have been validated and calibrated, going back to 1979 or earlier.

Figure 3: Extreme Hs return period value as a function of return period at the Wave Rider, showing TC Gabrielle was equivalent to a 3,000-year Hs storm at that location.
An extreme value analysis was performed based on MetOcean Solutions’ hindcast data using a standard Peaks Over Threshold method to select storm peaks combined with a fitted Generalised Pareto Distribution to extrapolate to longer return periods than the actual hindcast duration. The results suggest the peak event represented a 3,000-year Hs storm for the location of interest (Figure 3).
“Our analysis suggests that a sea state with wave heights (Hs) of 6.0 m would occur on average only once every 3,000 years at the Wave Rider location,” explains Séverin.
“Although these events tend to occur more frequently due to climate change, they remain rare and are not necessarily accounted for in hindcast models. To accurately estimate the impact of these events on the sea state and storm surge, a synthetic storm database for the New Zealand waters would be very beneficial.”
MetOcean historic data and analytical services provide critical information required for management and design of key infrastructure and assets – and the ability to place these extreme events in context.
For more information contact us at enquiries@metocean.co.nz
---------
Notes: Peaks Over Threshold combined with a fitted Generalised Pareto Distribution is one way to model extreme values. It uses a threshold to segregate values considered extreme from the rest of the data and create a model for the extreme values.