
A Fully Coupled Wave–Hydrodynamic Model for New Zealand
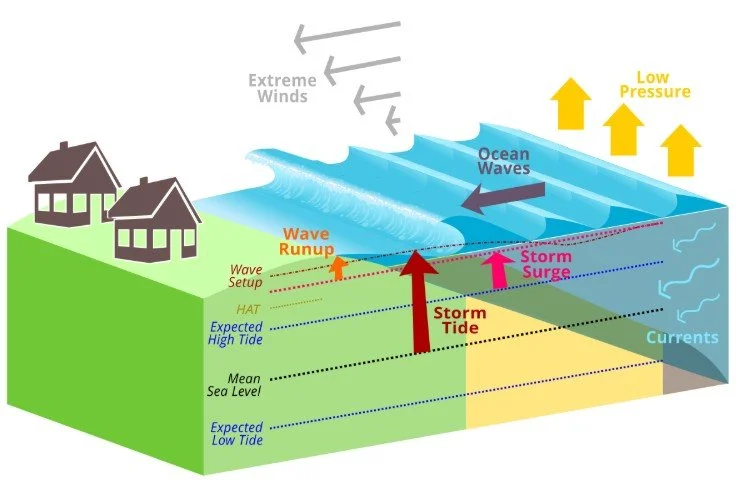
Figure 1: Coastal processes and water level components of a severe coastal storm event.
Coastal and nearshore processes—such as elevated water levels and storm surge, large waves, and strong currents—are driven not only by a range of physical forcings (including tides, wind, atmospheric pressure, waves, and large-scale ocean circulation), but also by the complex interactions between these forcings (Figure 1).
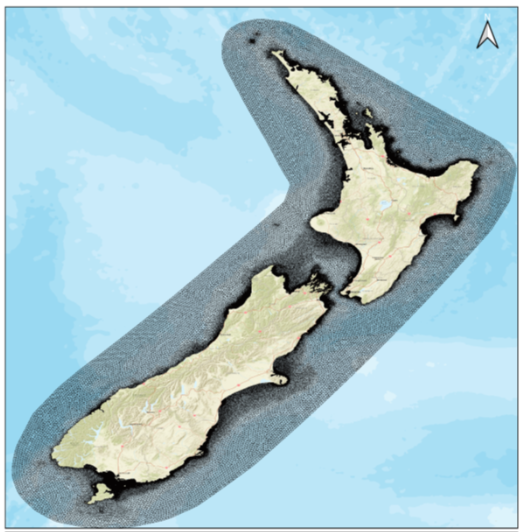
Figure 2: New Zealand coupled wave/hydrodynamic WWM/SCHISM mesh
To accurately represent and predict coastal processes, numerical models must therefore account for the combined effects and interactions of all relevant forcings.
At MetOcean Solutions / MetService, we have developed a fully coupled wave and hydrodynamic model covering the entire New Zealand coastline, providing high-resolution data for coastal and nearshore regions nationwide.
The model operates in both:
Forecast mode, delivering water level, current, and wave forecasts with a 5-day horizon, and
Hindcast mode, simulating historical periods to produce datasets for trend analysis, extreme value assessment, and use in a wide range of nearshore and coastal investigations.
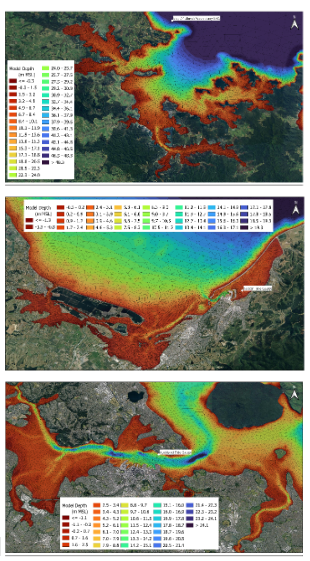
Figure 3: Example of nearshore WWM/SCHISM mesh
The model domain is defined by the horizontal grid shown in Figure 2 above. The computational mesh extends approximately 100–150 km offshore from the New Zealand coastline and penetrates into all tidal harbours and inlets. Mesh resolution varies from approximately 6 km at the open ocean boundary to 30–50 m along the coastline and within narrow channels and upstream areas (see nearshore examples on Figure 3). The model has been validated against tidal and wave observations from sites around New Zealand.
This modelling system enables detailed representation of wave and current patterns across New Zealand’s nearshore zone, as well as improved estimation of storm surge and wave setup at the coast, supporting robust coastal hazard and impact assessments (Figure 4 and Figure 5). The data have already been applied to storm-tide coastal inundation studies, nearshore tracer transport, and other coastal engineering and scientific analyses.
The operational version of the NZ model is deployed on our forecasting stack and provide nearshore forecast of all key nearshore metocean parameters (an example of storm surge forecast is presented in the animation below in Figure 6)
Model outputs are easily accessible through the MetService Insight platform, making this dataset a valuable resource for scientific institutions, engineering and consultancy firms, insurance providers, government agencies, and other coastal stakeholders.
Please contact us to discuss this product in more detail or to explore potential applications.
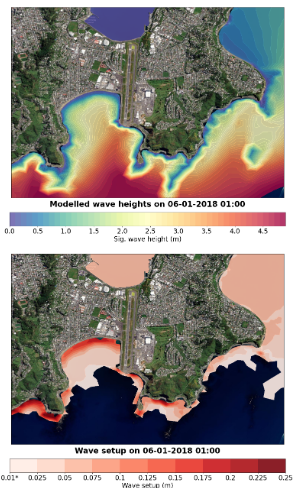
Figure 4: Example of modelled significant wave heights and wave setup at Lyall Bay in Wellington.
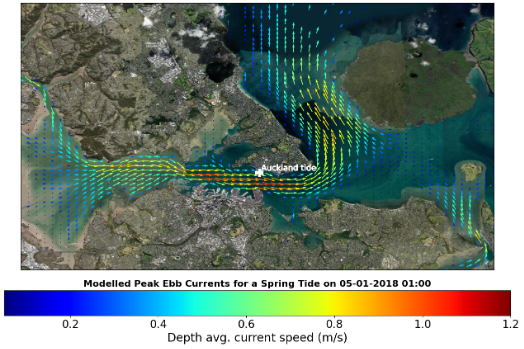
Figure 5: Example of modelled peak ebb current vectors in Auckland Harbour.
Figure 6: Example of storm surge forecast