
From Anecdote to Analysis: Quantifying Extreme Storm Events
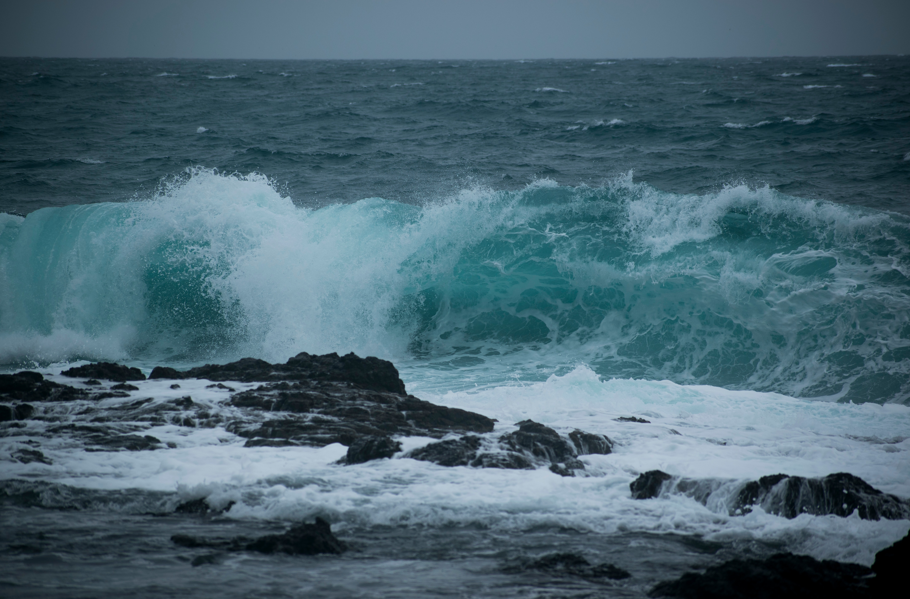
Image Credit - Mireya Montano
We all remember that storm, the really big one.
“Those waves were enormous!”
“The wind was absolutely crazy!”
“That’s the strongest storm I’ve ever seen.”
These kinds of weather stories are common, whether shared on the beach or over a drink at the local pub. They’re colourful, animated, and always entertaining. But the question remains: was that storm truly extreme? Statistically extreme?
For coastal asset owners, government agencies responsible for public safety and shoreline management, insurance providers, and coastal engineers designing maritime and coastal structures, accurately understanding extreme events is critical.
Was the wind simply stormy, or was it an extreme event to which we can assign a return period?
What is a return period?
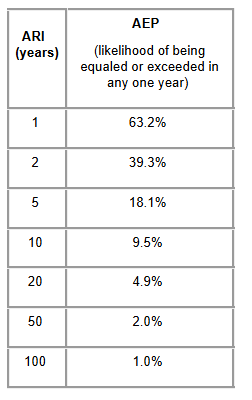
Table 1: Annual Exceedance Probability (AEP) for each Average Return Interval
A return period, also known as the Average Recurrence Interval (ARI), is the average time expected between occurrences of a natural hazard (such as severe storms or large wave events) of a specific magnitude.
For example:
A 100-year storm does not mean it occurs exactly once every 100 years.
It means that, on average, it has a 1% probability of being equalled or exceeded in any given year. This is called the Annual Exceedance Probability (AEP) of an event (see Table 1).
Importantly, a 100-year event can occur more than once within a short period, a common misconception is that it cannot.
Turning data into insight
At Metocean Solutions, we have developed high-resolution global hindcasts of metocean parameters, with extensive coverage across New Zealand, Australia, the Pacific Islands, Southeast Asia, the Middle East, South America, and Europe.
While these datasets are accessible through the MetService Insight platform, the real value lies in the statistical analysis performed by our experienced scientists.
Our metocean team routinely undertakes:
Long-term trend analyses of storm events, including changes in storm frequency and severity over selected periods.
Trend analyses of storm wind intensity and large wave heights, and their relationship with large-scale climate variability.
Analyses of storm frequency, including year-to-year fluctuations in the number of storms based on wind speed and wave-height peaks.
One particularly insightful output is the number of storms equivalent to, or exceeding, specific return-period thresholds. Results from the analysis of our metocean data at a site along the coast are presented in Table 2 . The tabulated values show the number of storm events equal to or greater than the 1-, 5-, 10-, 20-, and 50-year ARI levels for each year over a 25-year period.
These results highlight how:
Some years may experience multiple events equivalent to a 1-year ARI
A relatively short period of time can still contain several 10- or even 20-year ARI events
So, back at the pub, that “once-in-a-lifetime” storm might actually have occurred several times over a given period, or it may genuinely have been the largest event someone will ever experience.
Understanding the difference requires data, statistics, and expertise.
Please contact us to discuss this product in more detail or to explore potential applications.
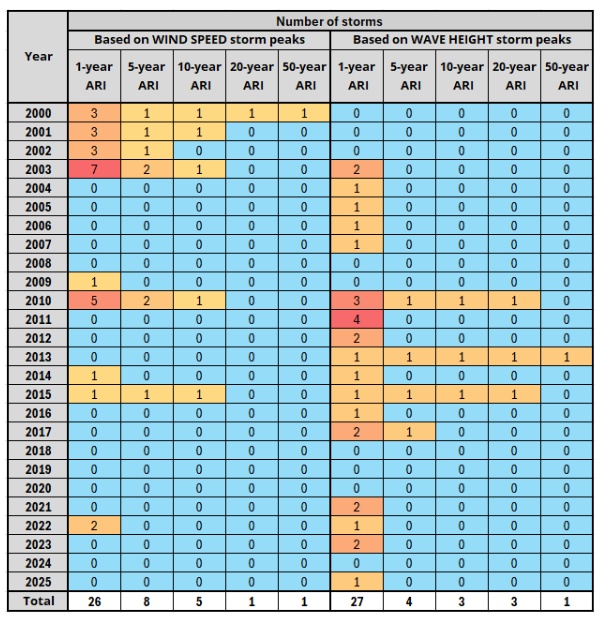
Table 2: Number of storms equivalent or above the 1, 5, 10, 20 and 50-year ARI Wind Speed and Significant Wave Height.